Updated October 2026 · Original data from US Meta ad accounts spending $100K to $2.3M a month · Refreshed quarterly
Most Meta ads statistics come from surveys or averages across thousands of small accounts. These come straight from the ad accounts of large US advertisers we have visibility into, spending $100K to $2.3M a month each.
This page collects the headline numbers from each of our data reports. Every section links to the full report, with the tables, methodology and FAQs.
Key Meta Ads Statistics for 2026
Costs and delivery
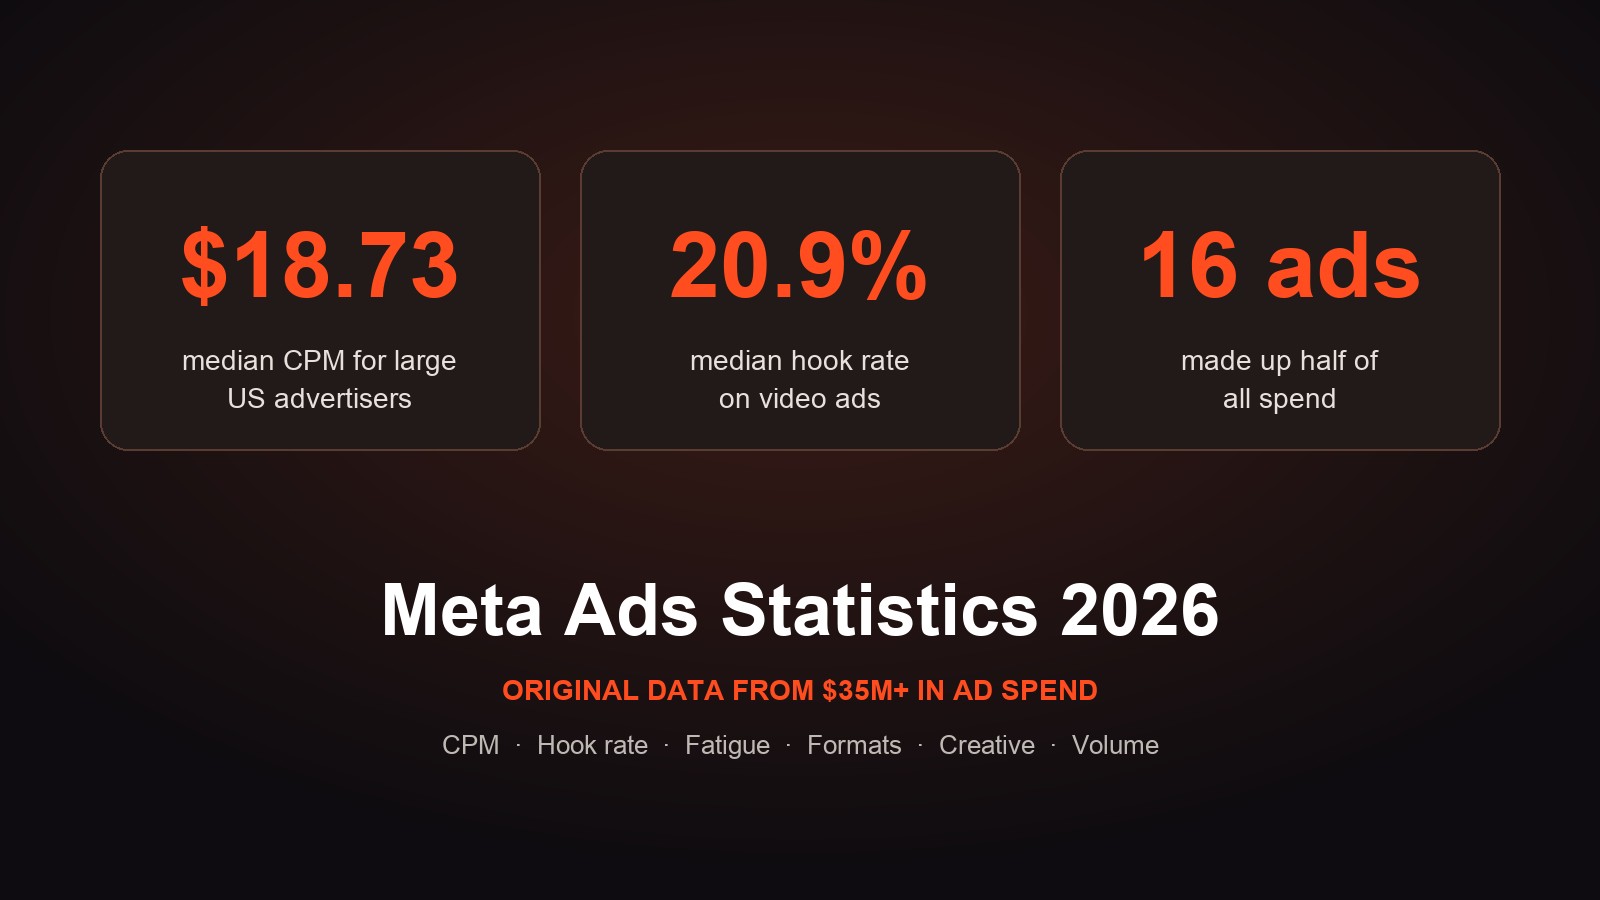
- The median CPM for large US Meta advertisers was $18.73 (June–August 2026). Source
- CPMs rose 26% over the summer, from $15.96 in June to $20.10 in August. Source
- Median CPM was $16.02 for DTC, $19.47 for CPG and $27.98 for tech brands. Source
- Median monthly frequency was 4.6, rising from 3.9 in June to 5.1 in August. Source
- Median conversion rate was 1.5% for CPG and 2.2% for DTC brands. Source
- On Black Friday 2025, CPMs were 57% higher than October, but consumer brands' cost per purchase was 42% lower. Source
- The median cost per link click was $2.18, and ecommerce brands paid a median $58 per purchase (July–October 2026). Source
- The median ecommerce brand paid about 46% of its order value to get a sale on Meta. Source
Video performance
- The median hook rate (3-second plays ÷ impressions) was 20.9%. The top 10% of video ads hit 45% or higher. Source
- The median hold rate (ThruPlays ÷ impressions) was 4.6%. Source
- Only about 1 in 5 people who watched 3 seconds kept watching to 15 seconds. Source
- Hook rate did not predict which ads got the most spend. The correlation was close to zero. Source
- The median video ad was 29 seconds long, and cost per result was about the same at every length. Source
- Viewers watched about 3 to 5 seconds on average, whether the ad ran 10 seconds or over a minute. Source
Spend concentration and fatigue
- In the median account, 16 ads made up half of three months of spend, and the top 10 ads took 41%. Source
- Three months later, top ads had kept only 29% of their spend. Source
- Two out of three top-10 creatives were new within a quarter. Source
Formats
- Static ads took 32% of spend and 4 in 10 top-spending ads. Source
- Statics had about 15% lower CPM than video and a cost per purchase within 4% of video's. Source
Creative
- Problem & solution ads showed up in all 17 accounts analyzed and took a median 31% of top-creative spend. Source
- Polished creative took a median 63% of top spend, versus 33% for creator-led. Truly lo-fi ads were rare. Source
- 16 of 17 accounts' top creatives opened with text on screen. Source
Creative volume
- The median large account had 75 creatives live (getting spend) at once. That's the total running, not new launches. Source
- That's about one live creative per $1,000 of weekly spend. Source
- Only about 17 creatives per account took 1% or more of three-month spend, and every account had between 7 and 25. Source
Meta Ad Costs: CPM, Frequency and Conversion Rate
From $35.3M in spend across the 23 highest-spending US accounts we have visibility into each month, June–August 2026:
| Median | |
|---|---|
| CPM (all accounts) | $18.73 |
| CPM change, June to August | +26% |
| Monthly frequency | 4.6 |
| Conversion rate (CPG / DTC) | 1.5% / 2.2% |
What it means: Meta got more expensive through the summer, and the typical user saw the same account's ads about once a week. Budget doesn't set your CPM. Two accounts spending about $800K a month paid CPMs more than 3x apart.
Full report: Meta Ads Benchmarks 2026: CPM, Frequency and Conversion Rates. Includes breakdowns by industry and by month. Updated quarterly.
Plug these numbers into our ROAS calculator to see how CPM and conversion rate change your CPA and ROAS.
Facebook Ad Costs: CPC, Cost Per Purchase and Cost Per Lead
From $27.1M in spend across US accounts that spent $100K or more, July 15 to October 14, 2026:
| Median | |
|---|---|
| CPM (consumer / apps and services) | $17.27 / $30.81 |
| Cost per link click | $2.18 |
| Link click-through rate | 0.98% |
| Cost per purchase (ecommerce) | $58 |
| Cost per lead (lead generation) | $40 |
What it means: Most pages quote CPMs of $4 to $15, but large US accounts paid far more. Apps and services paid almost twice what consumer brands did. The median ecommerce brand paid about 46% of its order value to win a sale.
Full report: How Much Do Facebook Ads Cost in 2026? Real Data From $27M in Spend. Includes ranges, Instagram costs and how to budget.
Black Friday and Q4 Costs
From about $6.9M a month in spend, October 2025 to January 2026, compared to each account's October average:
| Consumer brands | CPM | Cost per purchase |
|---|---|---|
| Black Friday | +57% | −42% |
| BFCM week | +35% | −20% |
| Dec 8–14 | +6% | +39% |
| Dec 29–Jan 4 | −24% | −24% |
What it means: CPMs spike during BFCM, but conversion rates more than tripled on Black Friday, so it was the most efficient day of the year. The week to watch is the second week of December, when costs were still high and shoppers had already bought.
Full report: Meta Ads During Black Friday: What Happened to CPM and CPA in 2025
Hook Rate and Hold Rate
From 479 video ads and $10.1M in spend across 17 accounts, June–August 2026:
| Median | Top 10% | |
|---|---|---|
| Hook rate | 20.9% | 45%+ |
| Hold rate | 4.6% | — |
What it means: Above 30% puts a hook in the top quarter. But the ads Meta spent the most on didn't have meaningfully higher hook or hold rates. Use hook rate to diagnose weak openings, not to pick winners.
Full report: Hook Rate and Hold Rate Benchmarks for Meta Ads. Includes formulas, benchmarks by category, and how to improve both.
Video Ad Length
From 421 video ads and $10.3M in spend across 21 brands, July–October 2026:
| Result | |
|---|---|
| Median video length | 29 seconds |
| Typical brand's video spend on 16–45 second ads | 61% |
| Average seconds watched | 3 to 5, at every length |
| Cost per result by length | Within 6% of brand median |
What it means: Length didn't predict which videos got spend or which were cheapest. Make the ad as long as the message needs, and put the work into the first 3 seconds.
Full report: How Long Should a Meta Video Ad Be? Data From 421 Ads
Creative Fatigue and Spend Concentration
From $22.9M in spend across 17 accounts, with winners tracked June–September 2026:
- A small number of ads take most of the budget: 16 ads made up half of spend in the median account.
- Winners hold up for about a month, then fade. After three months they kept a median 29% of their spend.
- Two out of three top creatives turn over each quarter.
What it means: Plan for a 2–3 month shelf life for your best ads. Their replacements need to be in testing before performance drops.
Full report: How Long Do Winning Meta Ads Last?
Static vs. Video
From 848 top ads and $14.9M in spend across 17 accounts, June–August 2026:
| Static vs. video | |
|---|---|
| Share of spend | 32% vs. 68% |
| CPM | 15% lower |
| Click-through rate | 13% lower |
| Cost per purchase | Within 4% |
What it means: Statics are cheaper to show but get fewer clicks, and the two roughly cancel out. The accounts that scale run both.
Full report: Static vs. Video Ads on Meta
What Winning Creatives Have in Common
From the 483 top-spending creatives in 17 accounts ($5.1M, August–September 2026), tagged by theme, emotion, hook and production style:
- They lead with a problem and a solution.
- They sell a positive feeling, not fear.
- They open with words on screen.
- They're cleanly produced. Polished beat lo-fi, and creator-led still took a third of spend.
- Most don't lead with a discount unless the business is subscription or app-based.
Full report: What the Best-Performing Meta Ads Have in Common
How Many Ads Large Accounts Run
From 17 accounts spending $100K+ a month ($7.7M in the last 30 days):
| Monthly spend | Creatives live at once (median) |
|---|---|
| $100K – $250K | 50 |
| $250K – $1M | 79 |
| $1M+ | 196 – 749 |
What it means: Plan for about one live creative per $1,000 of weekly spend, expect 15–25 of them to carry the budget, and replace about a quarter each month.
Full report: How Many Ads Should You Run on Meta?
How We Collect This Data
- Source: US Meta ad accounts we have visibility into as a creative agency. Most reports use accounts spending at least $100K over the period studied. The video length report includes brands spending $50K or more, and the Black Friday report includes accounts spending $30K or more in October 2025.
- Accounts: consumer brands (food, beverage, supplements, pet, beauty and household) and apps and services (software, streaming, telecom, fintech and health).
- Method: we report medians and compare performance within each account before combining. That way one very large account can't skew the results.
- Privacy: all data is aggregated and brand names are anonymized.
- Updates: this page and the benchmark report are refreshed quarterly. The next update is planned for January 2027.
FAQ
What is the average CPM on Meta in 2026?
Among large US advertisers, the median Meta CPM was $18.73 from June to August 2026. It rose from $15.96 in June to $20.10 in August. DTC brands paid the least ($16.02) and tech brands the most ($27.98).
How much do Facebook ads cost?
From July to October 2026, large US accounts paid a median $17.46 per 1,000 impressions and $2.18 per link click. Ecommerce brands paid a median $58 per purchase, and lead-generation accounts $40 per lead.
How much do Meta CPMs go up on Black Friday?
On Black Friday 2025, CPMs were 57% higher than the same accounts' October average. Conversion rates more than tripled, so consumer brands' cost per purchase was 42% lower than October.
What is a good hook rate for Meta ads?
The median hook rate was 20.9%. Above 30% is top-quarter, and the top 10% of video ads reached 45% or higher.
How long should a Meta video ad be?
The median video ad was 29 seconds, and most spend went to ads between 16 and 45 seconds. Cost per result was about the same at every length, so make the ad as long as the message needs.
How long do Meta ads last before fatigue?
Top-performing ads typically held up for about a month. After three months, they had kept only 29% of their spend, and two of every three top creatives were replaced within a quarter.
Do static ads still work on Meta?
Yes. Statics took about a third of spend and 4 in 10 top-spending ads, with a cost per purchase within 4% of video.
How many ads should you run on Meta?
Large accounts had a median of 75 creatives live at once, about one per $1,000 of weekly spend. Only about 17 of those carried most of the budget.
Where do these Meta ads statistics come from?
From US Meta ad accounts Biddyco has visibility into as a creative agency, each spending $100K or more over the period studied: $35M+ in total spend. All data is anonymized and aggregated. Each report links to its full methodology.
Turn the Data Into Better Ads
Biddyco is a creative agency for Meta ads for brands spending $100K–$5M+/month. Our in-house team makes UGC, motion, static and hybrid ads on a flat monthly retainer, built on what the data says actually works.