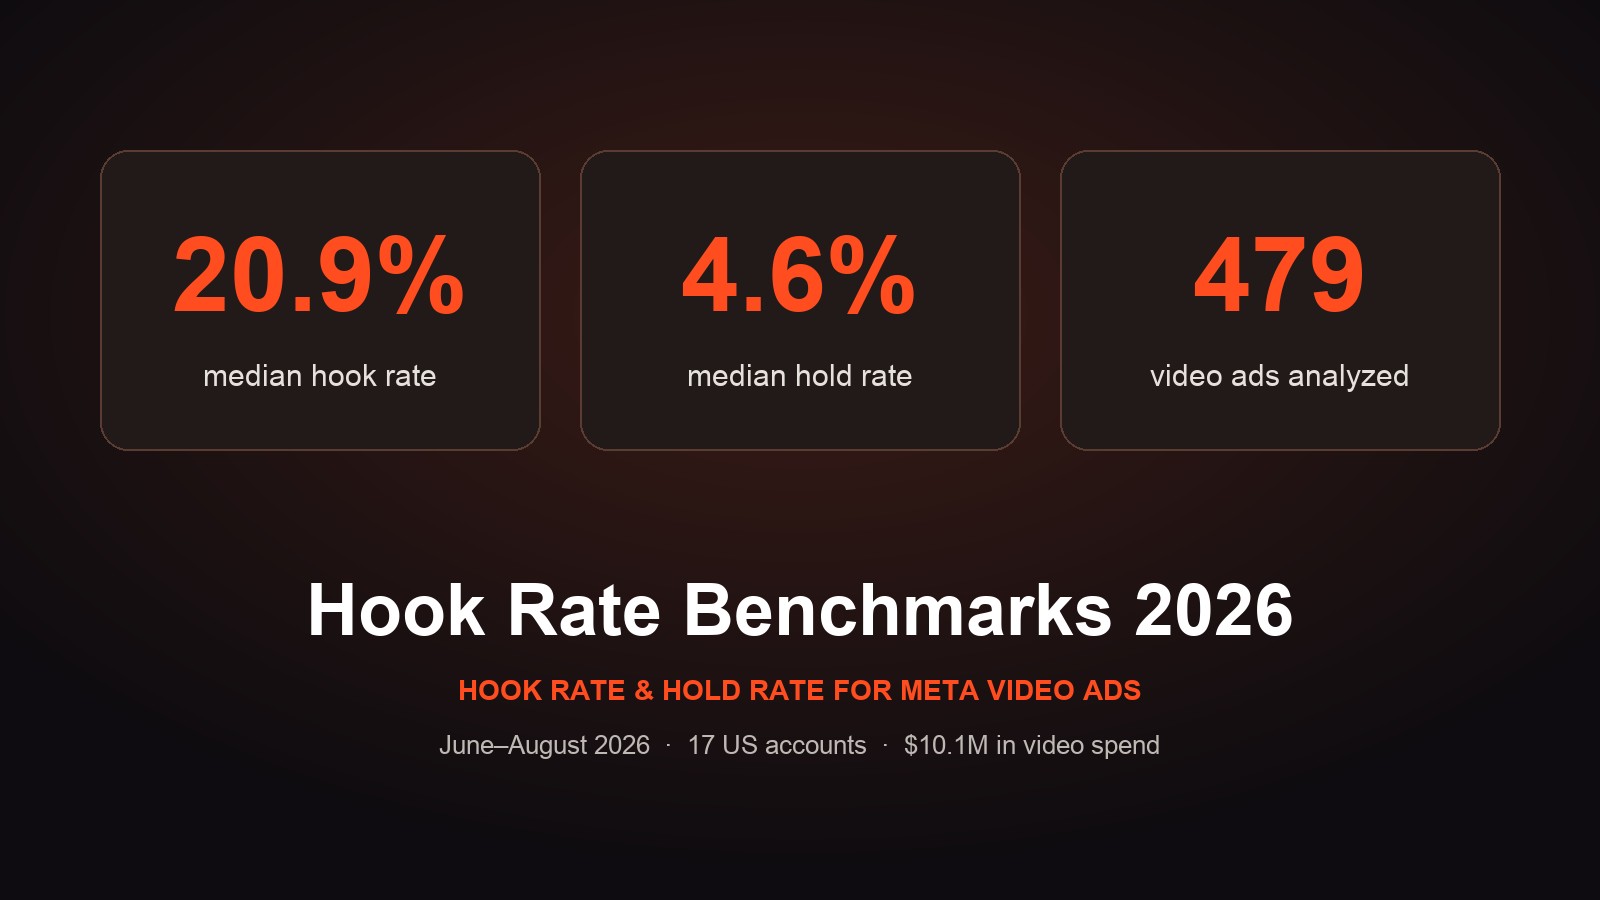
Data: June–August 2026 · 479 video ads from 17 US ad accounts · $10.1M in video ad spend
Part of our Meta Ads Statistics 2026 report.
The Short Answer
Hook rate is the share of video ad impressions where someone watched at least 3 seconds: 3-second video plays ÷ impressions. It tells you whether the opening of your ad stops the scroll.
Across 479 Meta video ads that each spent at least $1,000 from June to August 2026:
- Median hook rate: 20.9%. The middle half of ads landed between 14% and 30%. The top 10% hit 45% or higher.
- Median hold rate: 4.6%. The middle half landed between 3% and 7%.
- Only about 1 in 5 people who watch 3 seconds make it to 15 seconds (a median of 22%).
- The typical viewer watched for about 4 seconds.
That's lower than most guides suggest. Many say a good hook rate is 25% to 30% or more. In real spend, the typical ad lands lower: across 479 ads and $10.1M, the median was 20.9%, and only about a quarter of ads reached 30%. If your hook rate is around 20%, you're normal, not failing.
And the finding that surprised us most: the ads Meta spent the most on did not have higher hook or hold rates than the ads it spent less on. Hook rate is a useful diagnostic, but it doesn't tell you which ads will win.
What Hook Rate and Hold Rate Mean (and How to Calculate Them)
Neither metric is built into Meta Ads Manager by default, so here's how to calculate them.
Hook rate (also called thumbstop ratio) is the share of impressions where someone watched at least 3 seconds:
Hook rate = 3-second video plays ÷ impressions
It measures whether your opening stops the scroll.
Hold rate is the share of impressions where someone kept watching to a ThruPlay (15 seconds, or the whole video if it's shorter):
Hold rate = ThruPlays ÷ impressions
It measures whether the rest of your ad keeps people watching.
A related number worth tracking is 3-second-to-ThruPlay retention (ThruPlays ÷ 3-second plays), which shows how many of the people you hooked you actually kept.
Some teams calculate hold rate as ThruPlays ÷ 3-second plays instead. We use impressions as the denominator for both, so the two rates are directly comparable.
The Data
We pulled June–August 2026 data from 17 US ad accounts we have visibility into, each spending $100K or more over the three months. For each account we looked at its top 50 ads by spend and kept the video ads that spent at least $1,000. That left 479 video ads with $10.1M in combined spend.
The accounts fall into two broad groups:
- Consumer brands (10 accounts): food, supplements, pet, beauty and household products
- Apps and services (7 accounts): software, streaming, telecom, fintech and health
We calculated hook and hold rates on video ads only, since static images don't have video plays. Brand names are anonymized.
Meta Hook Rate Benchmarks
| Median hook rate | Middle 50% | Top 10% | |
|---|---|---|---|
| All video ads | 20.9% | 14.2% – 30.4% | 44.8%+ |
| Consumer brands | 22.0% | 15.0% – 35.4% | 50.2%+ |
| Apps and services | 20.0% | 13.6% – 28.0% | 36.2%+ |
What counts as a good hook rate? Based on this data:
- Under 14%: bottom quarter. The opening likely isn't stopping the scroll.
- About 20%: typical for a large account.
- 30% or higher: top quarter. About a quarter of ads in this data reached it.
- 45% or higher: top 10%.
Hook rates also varied a lot by account, from a median of about 13% in one account to 41% in another. Product, audience and placement mix all play a role, so compare your ads to your own account's median first.
Meta Hold Rate Benchmarks
| Median hold rate | Middle 50% | |
|---|---|---|
| All video ads | 4.6% | 3.0% – 7.3% |
| Consumer brands | 4.6% | 2.9% – 7.3% |
| Apps and services | 4.6% | 3.1% – 7.3% |
Hold rates were remarkably consistent across categories. A few other numbers help put them in context:
- Median 3-second-to-ThruPlay retention: 22%. Of the people who watch the first 3 seconds, roughly 1 in 5 stays to 15 seconds.
- Median average watch time: about 4 seconds.
- Median first-frame retention: 88%. Most people who get served a video let it start. The drop-off happens after the first frame, which is why the first 1–3 seconds matter so much.
The Surprising Part: Hook Rate Doesn't Predict Winners
If hook rate were the key to a winning ad, the ads Meta spends the most on should have the highest hook rates. They don't.
- Top spenders vs. everything else: within each account, the 5 video ads with the most spend had a median hook rate of 22.0%. The rest had 20.7%. Hold rate was 5.0% vs. 4.5%. The difference is small.
- Within accounts, spend and hook rate were basically unrelated. Ranking each account's ads by spend and by hook rate, the correlation was close to zero. The same was true for hold rate and click-through rate.
- High-hook ads cost more to show. In the median account, the quarter of ads with the highest hook rates had about 1.5x the click-through rate of the lowest quarter, but also about 1.4x the CPM. They didn't have a lower cost per purchase.
Part of this is how Meta delivers ads. It optimizes for the result you ask for, usually purchases or sign-ups, not for views. Hook rate also depends on placement: an ad delivered mostly in Reels and Stories will usually show a different hook rate than one delivered mostly in lower-cost placements. So two ads with very different hook rates can end up with similar results.
What this means
- Use hook rate as a diagnostic, not a goal. It's great for spotting a weak opening. If a video's hook rate is far below your account median, test new first seconds.
- Don't kill an ad just because its hook rate is average. If it's converting, it's working. Plenty of top-spending ads in this data had ordinary hook rates.
- Don't chase hook rate with clickbait. An opening that stops the scroll but doesn't connect to the product can raise hook rate and CPM without raising sales.
- Judge ads on the result you pay for. Cost per purchase, cost per lead or cost per trial should decide winners. Hook and hold rate help explain why.
How to Improve Hook Rate and Hold Rate
When a video's hook rate or hold rate is below your account median, these are the fixes we reach for first:
To raise hook rate (the first 3 seconds):
- Open on the most visual moment, not a logo or slow build-up
- Put a clear, specific line on screen in the first second
- Start mid-action, with a person, a product demo or a surprising visual
- Test several openings on the same body. It's the cheapest way to create new variations
To raise hold rate (seconds 3–15):
- Deliver on the hook quickly instead of stalling
- Keep cuts and on-screen text moving
- Put proof (a demo, a result, a review) in the first 10 seconds
- Consider a shorter cut: if most people leave by second 8, make an 8-second version
Formats matter too. UGC, motion and hybrid openings each stop different people, which is another reason to run a real mix.
FAQ
What is hook rate?
Hook rate is the percentage of video ad impressions where someone watched at least 3 seconds. It measures whether the opening of an ad stops the scroll, and it's also called thumbstop ratio.
What is a good hook rate for Meta ads?
In our data, the median hook rate for Meta video ads was 20.9%. The middle half of ads landed between 14% and 30%, and the top 10% reached 45% or higher. Above 30% puts an ad in the top quarter. That's lower than the 25% to 30% many guides call good, so a hook rate around 20% is normal.
How do you calculate hook rate?
Hook rate = 3-second video plays ÷ impressions. It's sometimes called thumbstop ratio, and it measures whether the first few seconds stop the scroll.
What is a good hold rate for Meta ads?
The median hold rate was 4.6%, with the middle half between 3% and 7%. Hold rate = ThruPlays ÷ impressions.
What is thumbstop ratio?
Thumbstop ratio is another name for hook rate: the share of impressions where someone watched at least 3 seconds of your video.
Does a higher hook rate mean a better ad?
Not necessarily. In our data, the ads Meta spent the most on didn't have meaningfully higher hook or hold rates than the rest, and high-hook ads often cost more per impression. Use hook rate to diagnose weak openings, but judge ads on cost per purchase or lead.
Where does this data come from?
479 Meta video ads from 17 US ad accounts we have visibility into, each spending at least $1,000 between June and August 2026, with $10.1M in combined spend. Brand names are anonymized. See our Meta ads benchmarks for CPM, frequency and conversion rate data.
Get Openings That Stop the Scroll
Hooks are one of the easiest things to test and one of the hardest to keep fresh. Biddyco is a creative agency for Meta ads for brands spending $100K–$5M+/month. Our in-house team makes UGC, motion, hybrid and static ads on a flat monthly retainer, with new hooks and concepts every month.