Data: June–August 2026 · the 23 highest-spending US accounts we have visibility into each month · $35.3M total spend
Part of our Meta Ads Statistics 2026 report.
The Short Answer
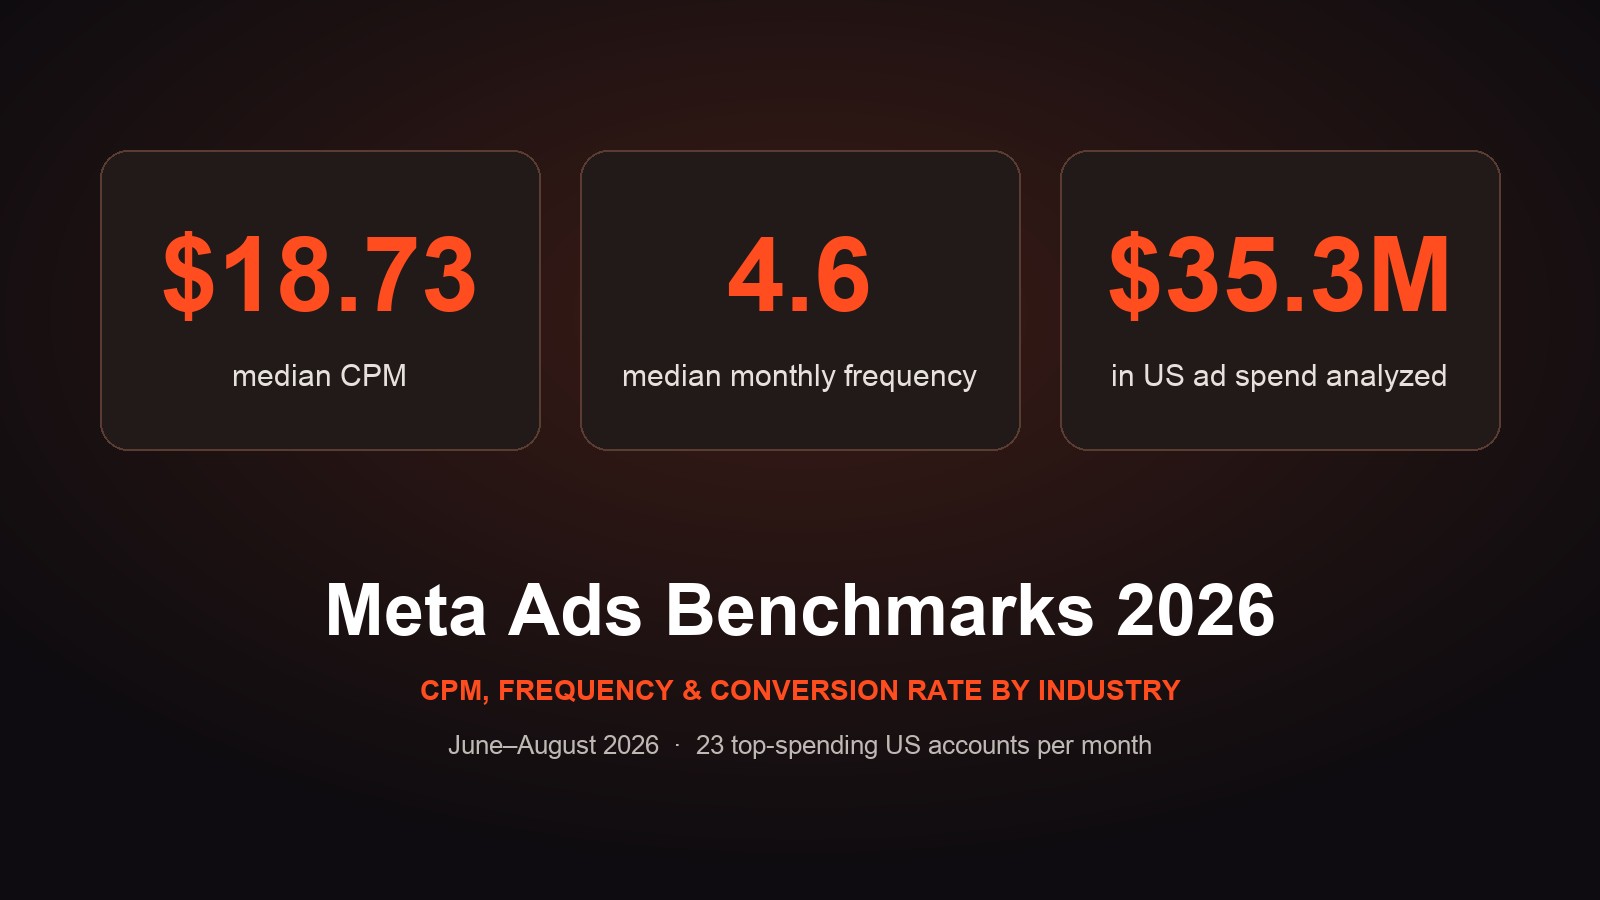
Across $35.3 million in Meta ad spend from June through August 2026:
- Median CPM: $18.73. It rose from $15.96 in June to $20.10 in August, a 26% increase.
- Median monthly frequency: 4.6. It climbed from 3.9 in June to 5.1 in August.
- Median conversion rate: 1.5% for CPG and 2.2% for DTC.
- By industry, DTC had the lowest CPMs ($16.02) and tech the highest ($27.98).
Most benchmark reports average thousands of small accounts. These are high-spending accounts, from roughly $100K to $2.3M a month each, so the numbers reflect what Meta looks like at scale.
The Data
We sit across roughly a hundred ad accounts. For this report, we pulled June, July and August 2026 data from the 23 highest-spending US accounts we have access to each month. Most accounts appear in all three months, and a few smaller ones move in and out of the top 23. They fall into three categories:
- CPG: food, beverage, supplement and household brands, many of which also sell in retail
- DTC: ecommerce brands that sell mainly through their own site
- Tech: apps and software
All accounts target the US. Brand names are anonymized. Frequency is measured monthly.
Meta CPM Benchmarks
Median CPM by industry (June–August 2026)
| Median CPM | Range | |
|---|---|---|
| All accounts | $18.73 | $3.80 – $61.88 |
| DTC | $16.02 | $3.80 – $52.30 |
| CPG | $19.47 | $3.84 – $53.46 |
| Tech | $27.98 | $10.01 – $61.88 |
Median CPM by month
| June | July | August | |
|---|---|---|---|
| All accounts | $15.96 | $16.35 | $20.10 |
| CPG | $14.61 | $26.18 | $26.03 |
| DTC | $15.39 | $15.10 | $17.19 |
| Tech | $29.38 | $25.11 | $27.98 |
What stands out:
- CPMs rose 26% over the summer for the typical account, with most of the jump in August. That lines up with advertisers ramping up for back-to-school and the second half of the year.
- CPG saw the biggest jump, from a $14.61 median in June to about $26 in July and August. DTC rose more gently, and tech stayed high all summer.
- CPMs vary about 15x, even at similar spend. In August, two accounts spending roughly $800K each paid $15.56 and $50.08. Budget doesn't set your CPM. Audience, optimization goal and creative do.
- The lowest CPMs belong to broad-reach accounts. The biggest spender, a CPG brand spending $1.8–2.3M a month, held a CPM of about $4.60–$4.80 all summer while reaching 57–69 million people a month. Broad targeting with creative that appeals to a wide audience is one of the most reliable ways to keep CPMs down.
- Tech pays the most. App and software audiences are smaller and more competitive, and those accounts often optimize for deeper events like trials or subscriptions, which Meta prices higher.
Weighted by spend, the average CPM stayed flat at about $14–$15 all summer, because that one large, low-CPM account makes up a big share of total spend. The median is a better picture of a typical large account.
Meta Ad Frequency Benchmarks
Median monthly frequency
| June | July | August | 3-month median | |
|---|---|---|---|---|
| All accounts | 3.9 | 5.0 | 5.1 | 4.6 |
| CPG | 3.8 | 4.8 | 4.7 | 4.5 |
| DTC | 4.2 | 5.3 | 7.6 | 5.8 |
| Tech | 3.6 | 4.1 | 3.9 | 3.7 |
Accounts running a monthly frequency of 7 or higher: 2 in June, 7 in July, 9 in August.
This is where the data pushes back hardest on common advice. You'll often hear that frequency above 2 or 3 means your ads are burning out. But:
- Frequency rose every month while spend held steady or grew. By August, 9 of the 23 accounts were above 7, and together they spent $5.4M that month.
- DTC brands climbed the fastest, from a median of 4.2 in June to 7.6 in August. They usually sell to narrower audiences, so the same people see their ads more often as spend grows.
- The top-spending account ran a frequency of 6.4 to 7.2 every month while spending $1.8–2.3M.
High frequency isn't automatically a problem. What matters is whether people are seeing the same ad over and over, or different ads from the same brand. Seven impressions of one tired ad is fatigue. Seven impressions spread across a skit, a demo, a review and a static is a brand showing up in different ways. That's why creative diversity matters so much at scale.
Conversion Rate Benchmarks
| June | July | August | 3-month median | 3-month range | |
|---|---|---|---|---|---|
| CPG | 1.6% | 1.5% | 1.4% | 1.5% | 0.00% – 3.6% |
| DTC | 2.1% | 2.1% | 2.3% | 2.2% | 0.04% – 18.8% |
- DTC converts better on Meta than CPG. DTC brands sell on their own site, so Meta sees the purchase. Many CPG buyers see the ad and then buy at a store or on Amazon, where Meta can't track it.
- Conversion rates held steady even as CPMs and frequency rose.
- One DTC account converted at 10–19% every month. It's an outlier, not a target to plan around.
- We left tech out of this table. Most of the tech accounts optimize for installs, sign-ups or trials rather than purchases, so their purchase conversion rates (a median of 0.2%) aren't comparable.
Why We Didn't Publish ROAS Benchmarks
We had ROAS and cost per purchase for most of these accounts, but we left them out on purpose. They'd mislead more than they'd help:
- Accounts optimize for different goals. An app optimizing for installs will show a tiny purchase ROAS, and that's by design.
- Retail sales are invisible to Meta. A CPG brand's in-platform ROAS can look weak while its ads drive a big share of store sales.
- Attribution settings vary from account to account.
Averaging those together would produce a number that doesn't describe anyone. Your ROAS target should come from your own margins and blended numbers, not an industry average.
To find your own target, use our ROAS calculator. Enter your gross margin and it shows your break-even ROAS, with the CPM and conversion rate benchmarks above built in.
What This Means for Your Account
- Plan for rising CPMs in the second half. A 26% rise from June to August is normal at scale. Budget for it rather than treating it as a performance problem.
- Don't panic over frequency on its own. Look at frequency alongside creative variety. If frequency is high and performance is dropping, the fix is usually new, genuinely different concepts, not a lower frequency cap.
- Use creative to lower CPM. The accounts with the lowest CPMs reach huge, broad audiences, and that only works when your ads appeal to a wide range of people. See how many ads per ad set we recommend to give Meta enough to work with.
- Benchmark against your own category. A $28 CPM is normal for tech and high for DTC.
- Keep new creative flowing without disturbing winners. Launch new concepts in their own ad set, as we explain in testing vs. scaling campaigns.
FAQ
What is a good CPM for Meta ads in 2026?
Across $35M in US spend from June to August 2026, the median CPM was $18.73. DTC brands paid a median of $16.02, CPG $19.47 and tech $27.98. Anything from about $10 to $30 is normal for US traffic at scale.
Are Meta CPMs going up?
In this data, yes. The median CPM rose 26%, from $15.96 in June to $20.10 in August 2026, with most of the increase in August. CPG brands saw the biggest jump.
What is a good ad frequency on Meta?
The median monthly frequency across these accounts was 4.6, and it rose from 3.9 in June to 5.1 in August. By August, 9 of 23 accounts ran a monthly frequency of 7 or higher while spending heavily.
How high is too high for Meta ad frequency?
There's no fixed number. Watch for frequency rising while click-through and conversion rates fall on the same ads. That's fatigue. High frequency with steady performance and a diverse creative mix is often fine.
What is a good conversion rate for Meta ads?
In this data, the median conversion rate was 2.2% for DTC brands and 1.5% for CPG brands. CPG is lower partly because many customers buy in retail stores, where Meta can't track the sale.
Where does this data come from?
June, July and August 2026 data from the 23 highest-spending US ad accounts we have visibility into each month, covering CPG, DTC and tech brands with a combined $35.3M in spend. Brand names are anonymized. We plan to update these benchmarks every quarter.
Get the Creative That Moves These Numbers
CPM, frequency and conversion rate all come back to creative. Biddyco is a creative agency for Meta ads for brands spending $100K–$5M+/month. Our in-house team makes UGC, motion, hybrid and static ads on a flat monthly retainer, built to give Meta the range of concepts it takes to scale. See our work for CPG, DTC and tech brands.