Results from $5 Million Spent on Facebook Ads and AdWords in 2017

Why we do this: In-house marketers and entrepreneurs have it tough. Managing just one ad account, you’re stuck in your vacuum, unsure if what you’re seeing in your ad campaigns is normal or not. As an agency, we’re in a privileged position to work with many eCommerce companies and have a much broader perspective into what’s working and what’s not across a variety of brands.
So we wanted to open up our data a bit (without sharing confidential client info) to give you a better idea of the larger landscape.
In this post, we wanted to do a 2017 annual review and take you through our numbers and results from spending several million dollars on digital advertising (Facebook ads and AdWords primarily).
Last year we worked with about 20 eCommerce brands. This dashboard is a general rollup of all of those campaigns into one so that we can get some high-level benchmarks.
This should be helpful for you in comparing your numbers against our clients.
Of course, every business is different and there’s different price points and customers so it’s not an apples to apples comparison, but this will give you a general idea of what our numbers looked like.
Cost per purchase:
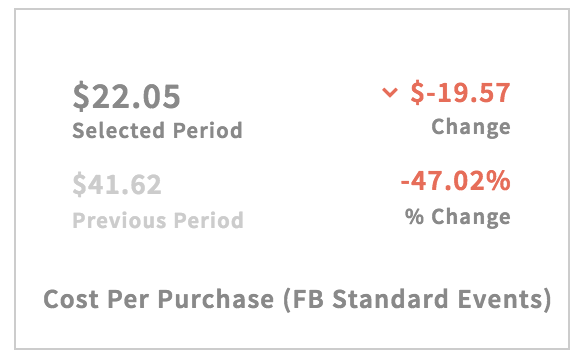
Our cost per purchase overall for 2017 was $22. This is very, very good to acquire paying customers. In 2016 we were at $41, so we cut that in half!
Depending on your price point and margins, $22 might be terrible or amazing. We’ve had clients who needed a $15 CPA to be profitable and other’s who were very happy with a $100 CPA.
ROI:
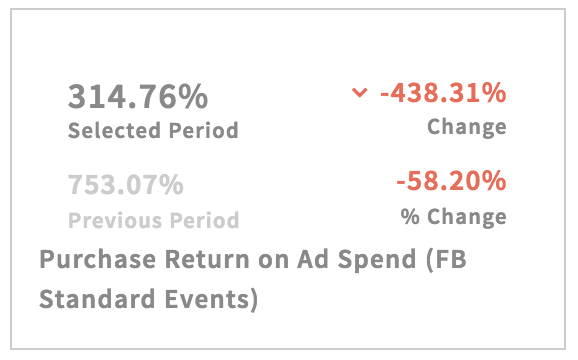
2017 ROI was over 3x, compared to 7x in 2016. HOWEVER, the 3x last year is actually way better because we were way more at scale. We spent much more money and ultimately made our clients more profit.
If you’re seeing about a 3x at a meaningful amount of spend, that’s normal based on what we’re seeing with different brands, different price points and industries.
A lot of people like to brag and feel good about their 20x ROI, but that’s almost always because they only spent a few hundred dollars and mainly did retargeting. Ok, so you spent $300 and made $8,000. Thats A.) Not that much money and B.) Not repeatable.
I’d rather consistently spend $80,000 a month and make back $240,000.
CPM / CPC:

Here there’s a very clear trend with Facebook and Google getting more expensive overall. CPM’s nearly doubled year over year.
The overall Cost Per Click went up 56%.
We’re definitely seeing these networks get more expensive and we’re going to see that in 2018 as well.
You’ll need to get used to paying more per click as these platforms get more and more competitive.
CTRs:

Note for the above, this is for link clicks, not ALL clicks. CTR for all clicks is normally around 2-4%. CTRs went up actually which is promising. This shows that ads are getting more engagement.
We should actually see this trend continue with the new updates Facebook announced with changes to the newsfeed.
Content and ads should get more engagement now that Facebook will be filtering out more and more organic branded content.
Conversion rate:
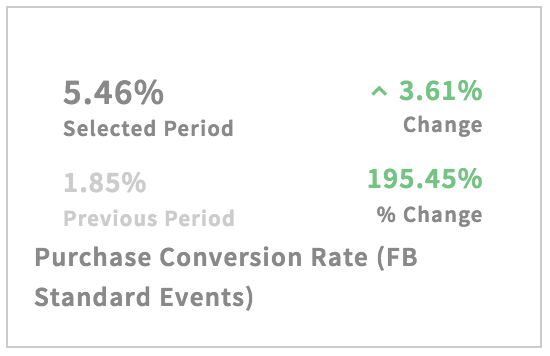
Over 5%!
This means that for 100 people going to a site, 5 pulled out their credit card and bought something.
Hopefully you’re at least a 2% conversion rate. Any less than that and it’s tough to scale and make the math work for paid traffic. But if you’re in the 2-5% range, you should be doing pretty well.
This big jump last year is partially a result of us as an agency getting better at targeting and also Facebook improving features like Lookalikes.
So take a look at your metrics and see how they compare to this!
JOIN OUR DAILY EMAIL LIST TO SEE EVEN MORE CREATIVE